Back To Home
Latest Ecommerce Stats To Understand Shopping Tendencies of Online Buyers [Infographic]
3260
Views
Most of the aspiring entrepreneurs look at Amazon and eBay in hopes of seizing ecommerce riches. However, with the speed at which ecommerce sector is evolving, it has become highly difficult to ascertain where it is headed. The market is poised to grow further and will keep on growing for years to come.
However, by just putting across a website you cannot expect the market to hand you the money. There are certain aspects that you need to keep in mind before you go about launching an online store. Other than creating a formidable ecommerce marketplace with a long list of features, you also need to analyze your targeted market and optimize it accordingly.
After spending countless hours on different studies, surveys and reports, we came across some crucial statistics that showcase the overall ecommerce industry. For everyone, associated or aspiring to be associated with ecommerce business it is a must to keep tabs on crucial market statistics. Delving into the numbers below will help you paint a crystal-clear picture of ecommerce- past, present and future and latest online shopping trends.


Online Shopping Stats:

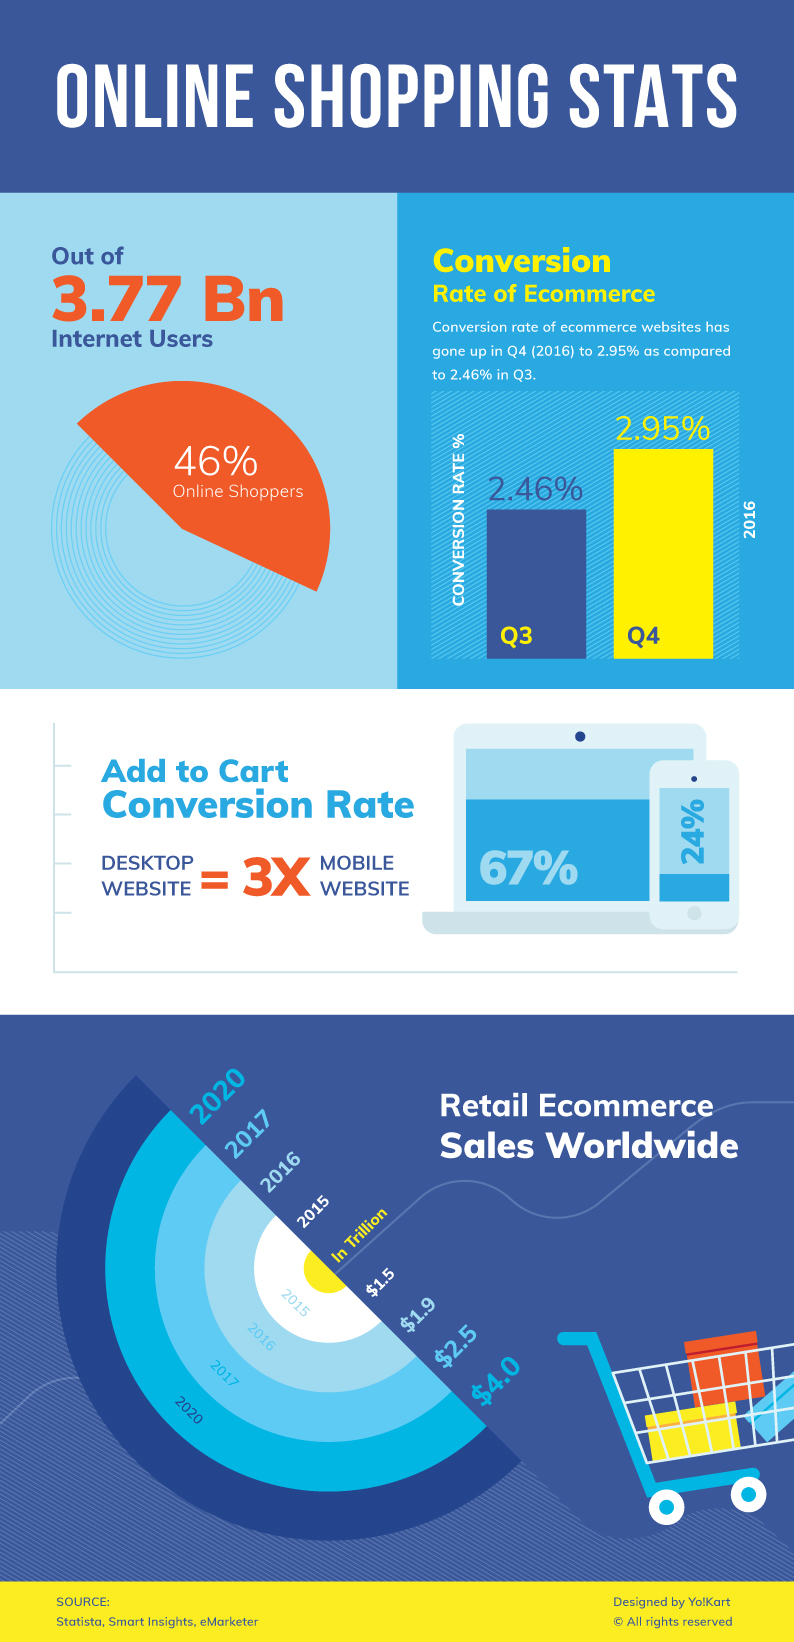
- Over 46% of the Internet users have made a purchase online via desktop, mobile, tablet or other online services in 2017.
- The digital buyer penetration worldwide currently is at 28.6% of the overall population.
- The conversion rate of ecommerce websites globally is 2.95 percent.
- As far as conversion rate based on platform is concerned desktops still had a lead over smartphones with 4.14 and 1.55 percent respectively.
- There has been a consistent rise in ecommerce share of the global retail sales since the last few years.
- The global ecommerce retail sale in 2016 was $1915 billion and has already crossed $2352 billion in 2017.
- The global e-retail sector is growing at the rate of 22 percent YOY and is expected to do so till 2020.
Country based Ecommerce Stats

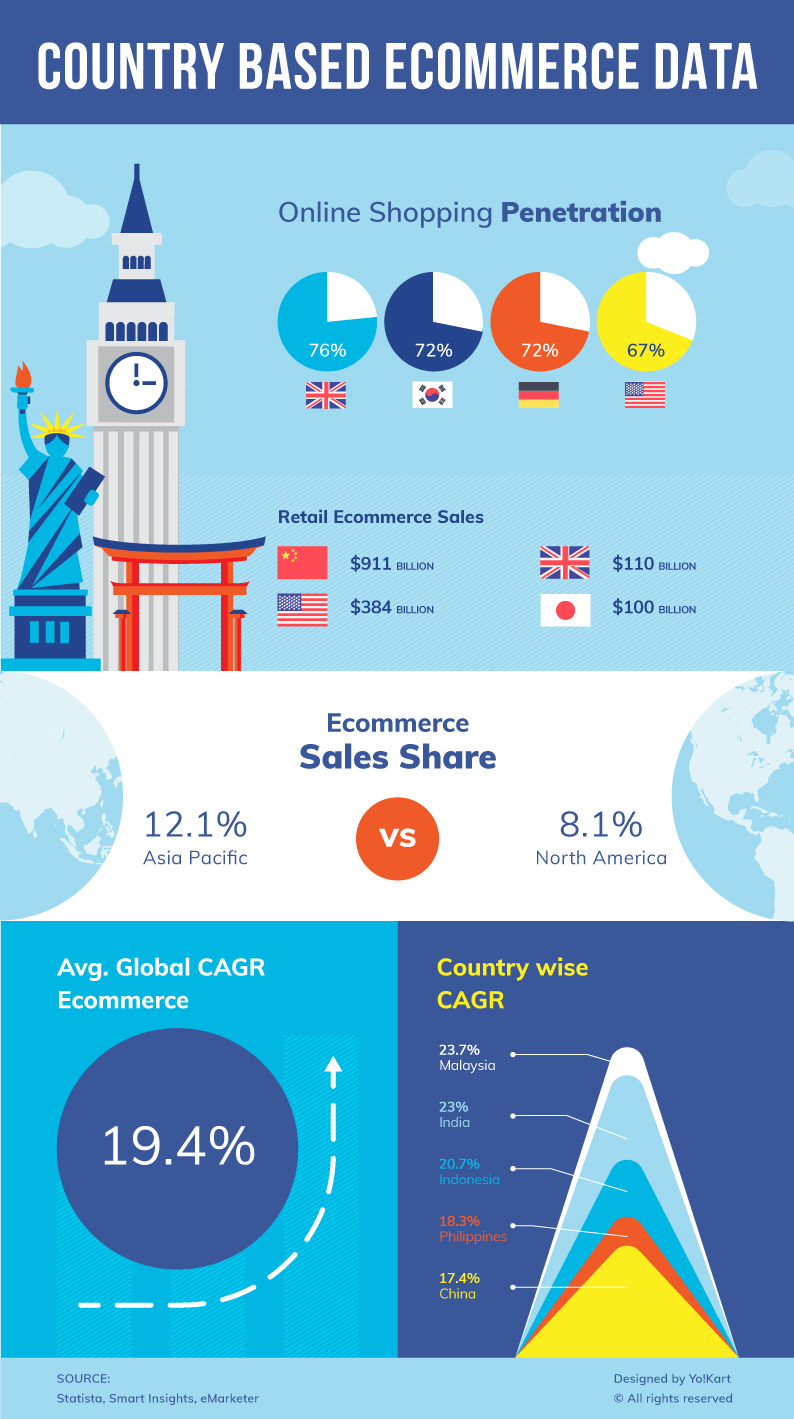
- UK, South Korea, and Germany topped the charts of highest online shopping penetration at 76%, 72%, and 72% respectively in the fourth quarter of 2016. Japan with 68% came in at third while the USA was placed fourth at 67%.
- Asia-Pacific region is leading the pack with its e-retail sales clocking 12.1 percent of overall retail sales, compared to 8.1 percent in North America.
- China leads the pack when it comes to retail ecommerce sales at $911.25 billion in 2016. USA, UK, and Japan follow China with $384 billion, $110 billion and $100 billion in retail ecommerce sales respectively.
- When it comes to B2C ecommerce markets, the same trend follows with China at $975 billion, USA at $648 billion and the UK at $192.5 billion.
- Malaysia and India have the highest compound annual growth rate when it comes to ecommerce. While Malaysia has a CAGR of 23.7 percent, India comes in close at 23 percent.
What, How and Why Consumers shop online

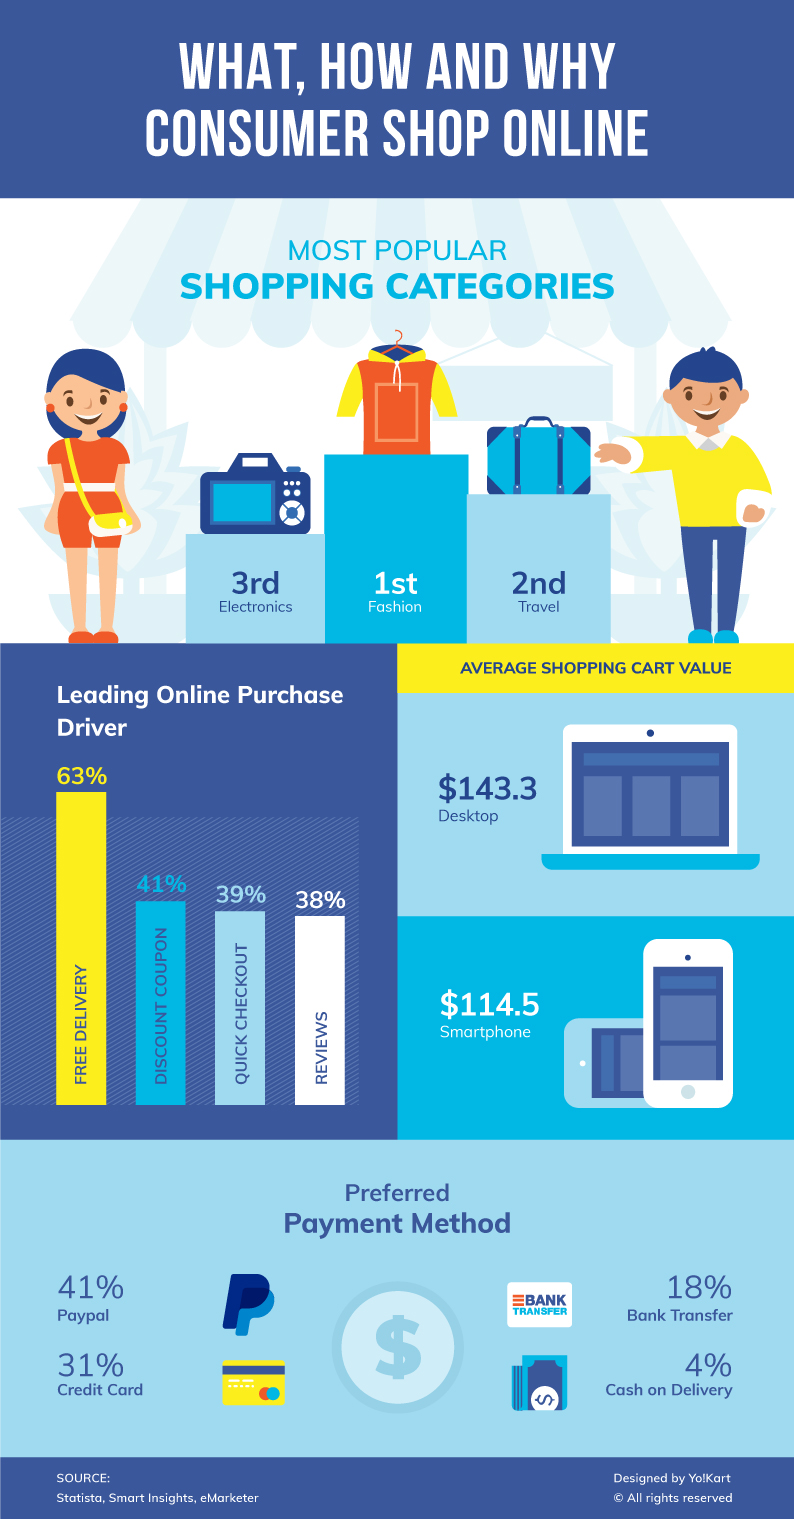
- The top two most popular online shopping categories worldwide in the last quarter of 2016 were fashion and travel. While 58 percent of global internet users purchased a fashion related products, travel-related products and services ranked second with a 55 percent global online purchase rate, while electronics came in at a distant third.
- The leading online purchase drivers which entice consumers to make a purchase online are free delivery (63%), discount coupons (41%), Quick and easy checkout (39%) and easy returns (38%).
- Almost 16 percent of the online shoppers worldwide make an online purchase once a week. This figure rises to 23 percent for once every 2 weeks and 31 percent once every month.
- An average value of global online shopping cart during last quarter of 2016 on a desktop was $143.35. The same for smartphones was $114.52.
- Consumers who came directly on the website have an average shopping order value of $129.92. Those who come from search engines have an average shopping cart value of $121.98, while those coming from social media had $91.67.
- Around 41% of the global consumers prefer PayPal as a payment method, while 31 percent choose a credit card. Around 18 percent choose bank transfer and just 4 percent opt for cash on delivery.


